Inventory variance calculator · 100% free · no signup
Inventory Variance Calculator
Compare what costs should have been (theoretical, from recipes) to what they actually were (from inventory). The gap is where waste, theft, and over-portioning live. Best operators run under 1%.
Why this matters
Variance is where the actual money is.
Food cost percentage tells you the symptom. Variance tells you the cause. Two operators can have identical 32% food cost, one through perfect execution at a 32% theoretical target, the other through 28% theoretical plus 4% leak.
Same number, completely different businesses. The first is operating at design efficiency. The second is bleeding $X,XXX a month and doesn't know it.
Operators who measure variance see the leak. Operators who measure only food cost % react to a number that has no actionable cause. The variance discipline is what separates well-run kitchens from lucky ones.
Three habits build it: weekly physical inventory at close, POS recipe costs kept current, daily waste log. None require software. All require consistency. Once those three exist, variance falls below 1% within 90 days at most concepts.
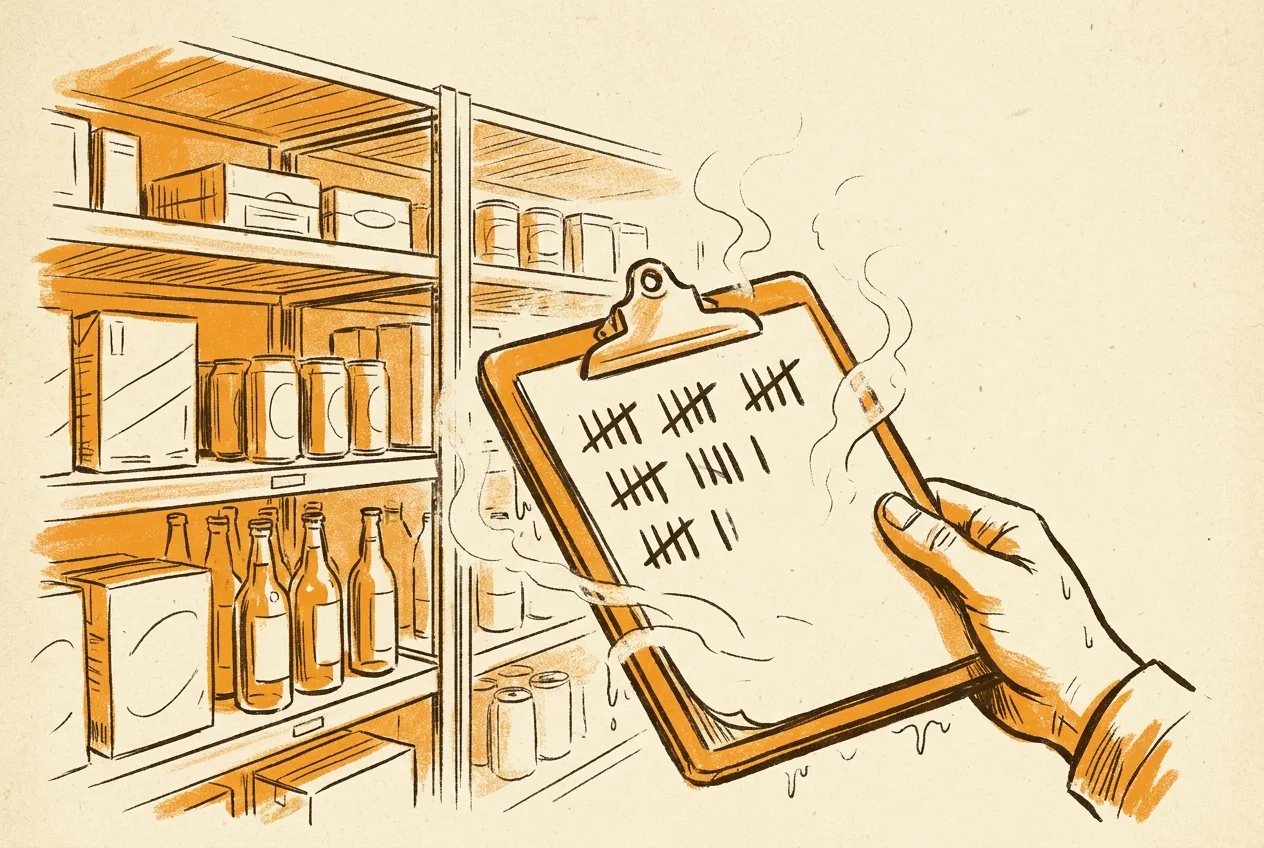
From the inventory sheet
Variance tells you something is wrong. It doesn't tell you what.
Bar inventory variance is the metric most operators learn the hard way. I learned it the hard way at Cosmos. We were running a healthy beverage program on paper. Sales were strong. Margins looked fine. Then I did a real bottle count for the first time in months, lined it up against the POS report, and found a gap I couldn't explain.
Variance isn't theft. Sometimes it's theft. More often it's three or four things at once, over-pours, comps not rung in, broken bottles nobody logged, a vendor short-shipping a case and the back-of-house signing for it without checking. Each one alone is small. Together they look exactly like a bartender skimming.
The first count was the worst. The second was easier. By the third weekly count, we'd built the discipline of looking for the gap instead of being shocked by it. That's the only thing that matters with variance, not finding zero gap, finding the gap before it gets big.
Best-in-class bar programs run under 1% variance. Most indie bars I've seen don't measure it at all. The gap between those two numbers is the entire moat.
The lesson I'd give my younger bartender self: count weekly, not monthly. Count by category, spirits, beer, wine, separately, not as a blob. And when the number jumps, don't assume theft first. Walk through the operational stuff in order: comp records, broken-glass log, recipe specs, inventory miscount. Theft is real, but it's the last suspect, not the first. Treating every variance spike as theft poisons team trust faster than the variance itself ever costs you.
I knew an operator in Florida, Joe, who runs Manolos, a hundred-year-old building that's somehow still standing through every recession. Joe was the opposite of every operator I'd seen up to that point. Nothing got wasted. Nothing got eaten by staff. No leftover plates went out as comps. If a server broke a dish, it came out of their tip-out that night. Every ounce was tracked. Every portion was weighed. Every comp was rung. The math was airtight.
Manolos is still open. Joe was right about every line item. And the staff hated working there. Servers turned over every six months. The cooks called him names behind his back. Customers loved the food but felt the tension in the room. The math was clean, and the team was bleeding the whole time. That's the other half of the discipline conversation that nobody puts on paper: variance discipline without team trust is its own slow leak. Different category. Same closure if it goes on long enough.
Felix at Flaco's gave the business away and closed. Joe at Manolos counted every grain of rice and burned out his team. The middle path, count weekly, treat your people like adults, run the investigation in the right order, is the only one that lasts.
This calculator gives you the variance number plus the dollar leak annualized. The number is your starting line. The investigation is yours. Run it weekly, and the calculator becomes a habit instead of an emergency. Run it without the human side, and the math will be perfect right up until your last server quits.
Real scenarios
Three variance stories
High variance hides real money. Track it, find it, fix it.
The 7% protein variance
Steakhouse, blended variance 4%. Owner thought it was acceptable. Then split by category: protein variance 7%, dry goods 1%.
Investigation revealed line cook trimming steaks heavy, taking trim home in cooler bag. Plus over-portioning ribeyes (10oz vs spec 8oz) on owner-comp meals.
Locked walk-in after close, installed scale on grill station, audited every comped meal weekly with management.
Protein variance to 1.5% in 6 weeks. $4,800/month margin recovered. Cook left voluntarily after lockdown.
The 9% bar variance
Cocktail bar, beverage variance 9%. Manager blamed inflation.
Variance audit: top 3 spirits accounted for 70% of the gap. Bartender free-pouring, comping shift drinks not in POS. Theoretical was 19%, actual 28%.
Installed measured pour spouts, mandated POS ring-in for every shift drink, reviewed top 5 spirits weekly with bartenders.
Variance to 2% in 8 weeks. Two bartenders left after the discipline arrived. Replacements onboarded clean from day one.
The 0.4% star
Family-owned casual diner, 30 years operating. Owner ran weekly variance. Average 0.4%.
Not luck, habit. Sunday close: physical count. Monday morning: theoretical from POS. Tuesday: variance review with kitchen team. Every week, every year, three decades.
No fix needed. Documented the practice as case study for newer operators.
Restaurant operates at 26% food cost where competitors run 32%. Six points of margin = ~$120K/year on their volume. Pure discipline, zero technology.
FAQ
Common questions
01 What is inventory variance?
Inventory variance is the difference between what your costs SHOULD have been (theoretical, based on recipes and items sold) and what they ACTUALLY were (real inventory consumed). Variance flags waste, over-portioning, theft, comping, and counting errors. Best operators target variance under 1%. Above 3% means real money is leaking.
02 How do you calculate inventory variance?
Variance % = Actual Cost % − Theoretical Cost %. Variance $ = Actual Cost − Theoretical Cost. Theoretical comes from your POS multiplied by recipe costs. Actual comes from inventory math: Opening + Purchases − Closing. The gap between them is variance.
03 What is a good variance?
Best-in-class operators target under 1% variance. 1–3% is acceptable in normal operations. 3–5% needs investigation. Above 5% is a red flag for theft, severe over-portioning, or systematic comping. Sustained variance above 8% usually means inventory counts are unreliable or POS recipe costs are outdated.
04 What causes high variance?
Ranked by frequency: (1) over-portioning, line cooks plating heavy, (2) waste, spoilage, trim, prep errors not tracked, (3) employee meals not rung in, (4) comps not tracked in POS, (5) theft, bartender pouring extra, line cook taking food home, (6) inventory counting errors, (7) outdated recipe costs in POS, (8) supplier short-shipping without invoice adjustment.
05 How do I lower variance?
Start with measurement: install scales on the line, train portion specs, log waste daily. Then process: track comps + employee meals through POS, recount inventory weekly not monthly. Then accountability: review variance with the team weekly, tie to bonus structure if appropriate. Best operators get to under 1% within 90 days of starting the discipline.
06 Is variance the same as shrinkage?
Closely related. Shrinkage is the dollar value of inventory lost to waste, theft, or counting error. Variance is the percentage measure. Both describe the same gap. "We had $1,200 in shrinkage" = "We had 2.4% variance on $50K food sales."
07 Should I track variance by category?
Yes, at minimum split protein, produce, dairy, and dry goods. Protein is usually the largest variance contributor (highest cost per unit, easiest to over-portion or steal). Tracking by category tells you where to focus. A 3% blended variance might be 1% on dry goods and 6% on protein.
08 How often should I run variance?
Weekly. Monthly hides too much, daily is too noisy. Weekly catches drift early enough to fix the next week. The discipline of physical inventory every Sunday at close is the foundation, without that, theoretical numbers don't mean anything.
09 Does this calculator save my data?
No. Nothing is stored, transmitted, or tracked. The calculation runs entirely in your browser and disappears the moment you close the tab. No signup, no email, no account.
Cited sources