What Is Menu Engineering (Stars / Plowhorses / Puzzles / Dogs)
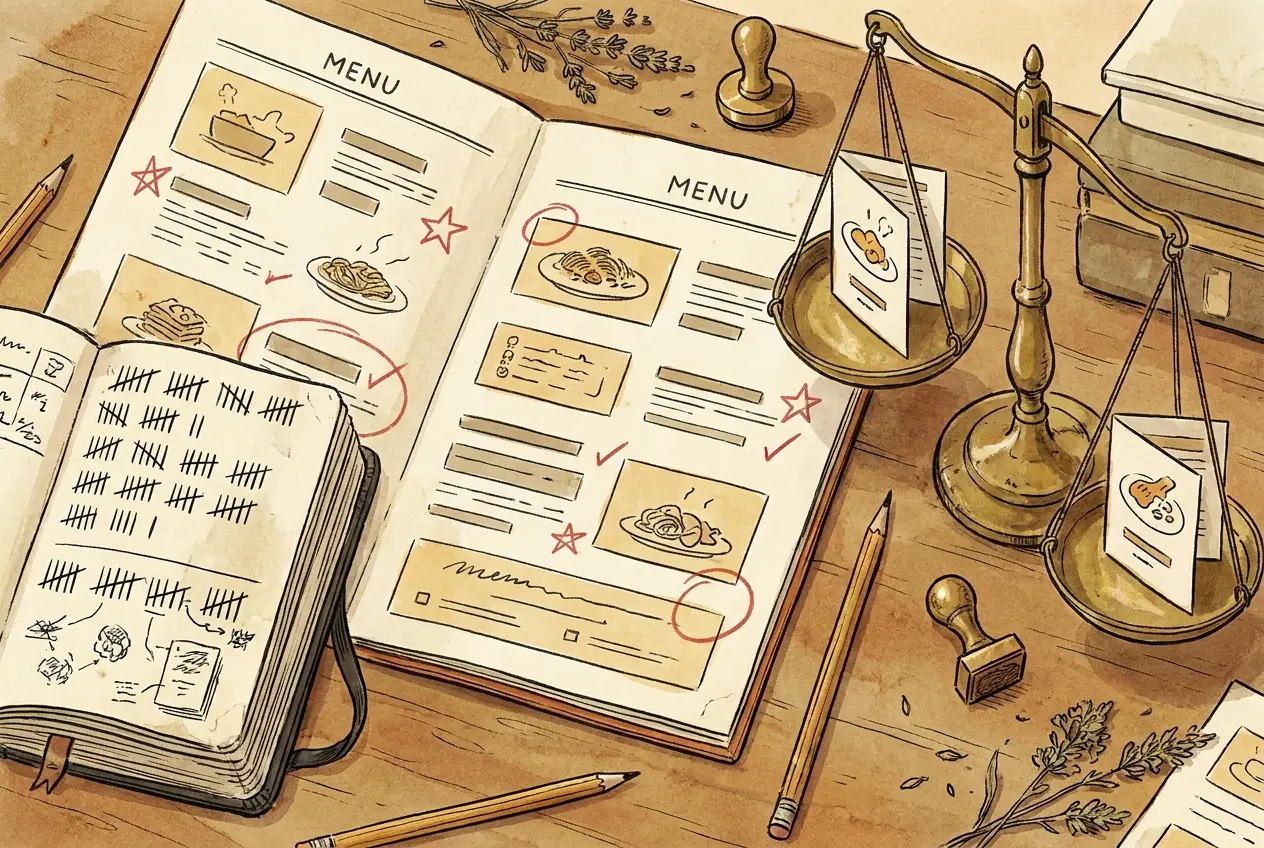
Menu engineering looks at your menu two ways at the same time: which items make you the most money per cover, and which ones get ordered the most. Plot those two against each other and you get a four-quadrant grid. Each box tells you what to do with the item sitting in it. Promote it, reprice it, move it, or kill it.
Most articles stop at the labels. This one does the math.
The two axes #
Contribution margin (CM) is profitability in dollars per item. The formula:
Contribution Margin = Menu Price − Food Cost (in dollars per item)
Watch the units here. CM is dollars, not a percentage. A $42 steak with 38% food cost has $26.04 of contribution margin. A $14 salad with 22% food cost has $10.92. So the steak makes you more per cover even though its food cost percentage is uglier. That’s the trap that gets operators chasing food cost % instead of CM dollars, and I’ve watched plenty of good operators fall in it.
Item velocity is popularity, measured as a percentage of category sales. The formula:
Velocity % = Units Sold of This Item ÷ Total Units Sold in Category × 100
If you sold 320 burgers, 180 salads, 240 sandwiches, and 110 entrees, the burger velocity in the “entree” category is 320 ÷ (320+180+240+110) = 37.6%. The category average velocity (if items were evenly distributed) would be 100% ÷ number of items.
The four quadrants #
Each item lands in one of four boxes depending on whether it sits above or below the category average on each axis.
Stars: above-average CM, above-average velocity. These make money and they sell. Promote and protect them. Feature them on the menu, train the staff to upsell them, never run out, and never quietly shave the portion or the quality when costs creep up. The Star is the one thing on your menu you are not allowed to mess with.
Plowhorses: below-average CM, above-average velocity. Popular, but the margin is thin. You want to re-cost or reprice these, carefully. They’re earning their keep on volume, so the per-cover dollar is the weak spot, not the demand. Go easy on the price hikes here. The popularity is more fragile than people think, and you can spook it.
Puzzles: above-average CM, below-average velocity. Good money, nobody orders it. The fix is reposition, train the upsell, or re-test before you touch the price or pull it. Usually it’s a placement problem or a description problem, not a food problem.
Dogs: below-average CM, below-average velocity. Low margin, low popularity, the easy one to cut. But check first. Sometimes a “dog” is a side that flops on its own as an entrée but shows up on half your tickets as a modifier. Pull the modifier data before you pull the item, or you’ll kill something that was carrying more weight than the menu line shows.
A worked example #
Restaurant with 8 entrée items, last month’s data.
| Item | Sold | Price | Food Cost | CM ($) | CM % | Velocity % | Category |
|---|---|---|---|---|---|---|---|
| Burger | 320 | $14 | $4.10 | $9.90 | 70.7% | 37.6% | Plowhorse |
| Salad | 180 | $14 | $2.40 | $11.60 | 82.9% | 21.2% | Star |
| Sandwich | 240 | $13 | $3.20 | $9.80 | 75.4% | 28.2% | Plowhorse |
| Steak | 110 | $42 | $14.40 | $27.60 | 65.7% | 12.9% | Puzzle |
Wait, that doesn’t show 4 quadrants because all four happen to be above or below average on each axis. Let me extend with more items.
| Item | Sold | Price | Food Cost | CM ($) | Velocity % | Quadrant |
|---|---|---|---|---|---|---|
| Burger | 320 | $14 | $4.10 | $9.90 | 25.5% | Plowhorse |
| Salad | 180 | $14 | $2.40 | $11.60 | 14.3% | Star |
| Sandwich | 240 | $13 | $3.20 | $9.80 | 19.1% | Plowhorse |
| Steak | 110 | $42 | $14.40 | $27.60 | 8.8% | Puzzle |
| Pasta | 95 | $18 | $3.60 | $14.40 | 7.6% | Puzzle |
| Wings | 280 | $13 | $4.70 | $8.30 | 22.3% | Plowhorse |
| Tacos | 22 | $16 | $4.20 | $11.80 | 1.7% | Puzzle (almost dog) |
| Salmon | 8 | $26 | $9.20 | $16.80 | 0.6% | Dog |
Total items: 1,255. Category average velocity: 12.5%. Category average CM: $13.78 (sum of CM × velocity weighted).
Quadrant analysis:
- Stars (above-avg CM, above-avg velocity): Salad. (High CM at $11.60, high velocity at 14.3%.)
- Plowhorses (below-avg CM, above-avg velocity): Burger, Sandwich, Wings.
- Puzzles (above-avg CM, below-avg velocity): Steak, Pasta, Tacos, Salmon.
- Dogs (below-avg CM, below-avg velocity): None in this example.
Now look at the Salmon. By the definition it’s a Puzzle, above-avg CM, below-avg velocity. But only 8 sold. At 8 units a month it’s really a Dog for practical reasons, because that’s not enough volume to justify keeping the SKU, the prep, and the cooler space. The matrix hands you the classification. You still have to apply operator judgment on top of it. That part doesn’t go away.
What to do with each quadrant #
Stars (Salad):
- Feature on the menu (top placement, photo if menu has photos)
- Train servers to upsell additions (added protein, premium toppings)
- Protect quality and portion, do not silently downsize when ingredient costs move
- Consider modest price increases (5-10%) since velocity suggests price tolerance
Plowhorses (Burger, Sandwich, Wings):
- Recost to find ingredient savings (without quality reduction)
- Test small price increases ($0.50-1.00) to see if velocity holds
- Look for high-CM modifier add-ons (premium toppings, sides) that lift the per-cover CM
- Do NOT reprice aggressively, the popularity is the asset
Puzzles (Steak, Pasta, Tacos):
- Reposition on the menu (move to top or top-of-category placement)
- Train servers to recommend (specific scripts: “Our most popular high-end item is…”)
- Reword the description to highlight value (origin of the protein, hand-made preparation)
- Re-test after 60 days; if velocity doesn’t move, consider removing
Dogs:
- Verify the item isn’t propping up modifier or side sales
- If standalone unprofitable AND unpopular, kill it
- Replace with a tested item from the same category that has better margin potential
When to rerun the matrix #
The matrix moves when your sales mix moves. Quarterly is the floor. Rerun it sooner than that when:
- You change a menu price
- A major ingredient cost shifts more than 5% (which moves CM)
- You add or remove an item
- Seasonal menu changes
- A new local competitor opens (sometimes shifts your sales mix)
The “run this once a year” advice you see floating around is just wrong. Your sales mix and your ingredient costs move every quarter, minimum. A year-old matrix is telling you about a restaurant you don’t run anymore.
The trap: optimizing for CM % instead of CM dollars #
The most common menu engineering mistake is reading contribution margin percentage when you should be reading contribution margin dollars.
A $14 salad with 22% food cost has 82.9% CM percentage. Looks great.
A $42 steak with 38% food cost has 65.7% CM percentage. Looks worse on paper.
But the steak’s CM in dollars is $27.60 against the salad’s $11.60. Per cover, the steak makes you 2.4x more money. The percentage was lying to you.
Here’s the whole thing in one line: you don’t pay rent in percentages, you pay it in dollars. Optimize for total CM dollars across the menu, not for whichever line item posts the prettiest CM percentage.
Where this bites hardest is menu placement. Feature the high-CM-dollar items even when their CM percentage is lower than the appetizers. A steakhouse that features its steaks at 38% food cost is doing it right. A steakhouse that features the salad at 22% food cost is handing money back at every table and calling it discipline.
What this looks like in the calculator #
The menu engineering calculator on this site does the plotting for you. Feed it your items, the sales counts, the prices, and the food costs, and it hands back the quadrant for each item plus the action that goes with it. Run it quarterly, or after any real menu change, and it’ll tell you what to feature, what to reprice, and what to cut.
For the underlying margin math, see Contribution Margin vs Food Cost Percentage.
What to do today #
Pull last month’s sales count by menu item. Pull the current food cost per item. Work out CM in dollars and velocity percentage, then plot the four quadrants. Once the matrix is built, the action list writes itself. Promote, reprice, reposition, remove.
The first time you do this you’ll find a Star you haven’t been featuring and a Dog you’ve been protecting out of pure habit. Both are easy wins, and both have probably been sitting there for months.
Sources: Toast, MarginEdge, Restaurant Peers, meez, Cornell Hotel School menu engineering research.
Read next
What's a Good Prime Cost for a Bar vs a Restaurant?
A healthy prime cost by concept, why bars run lower than kitchens, and what your number should be. The benchmark, not the formula. From a 5-year GM.
How to Price a Cocktail (The Pour Cost Math Bars Skip)
How to price a cocktail off its real pour cost, the multiplier that works, and a worked build from spirit to menu price. From a 5-year bar GM.