Field notes from the line
Real operator stories. Real numbers. No listicles.
First-person analysis from independent restaurant managers, GMs, and owners. Specific incidents. What worked, what backfired. Cited industry sources. Written by a 5-year bar GM, not a content farm.
Latest
01
What's a Good Prime Cost for a Bar vs a Restaurant?
A healthy prime cost by concept, why bars run lower than kitchens, and what your number should be. The benchmark, not the formula. From a 5-year GM.
Read the full pieceMore posts
 02
02 How to Price a Cocktail (The Pour Cost Math Bars Skip)
How to price a cocktail off its real pour cost, the multiplier that works, and a worked build from spirit to menu price. From a 5-year bar GM.
Read the piece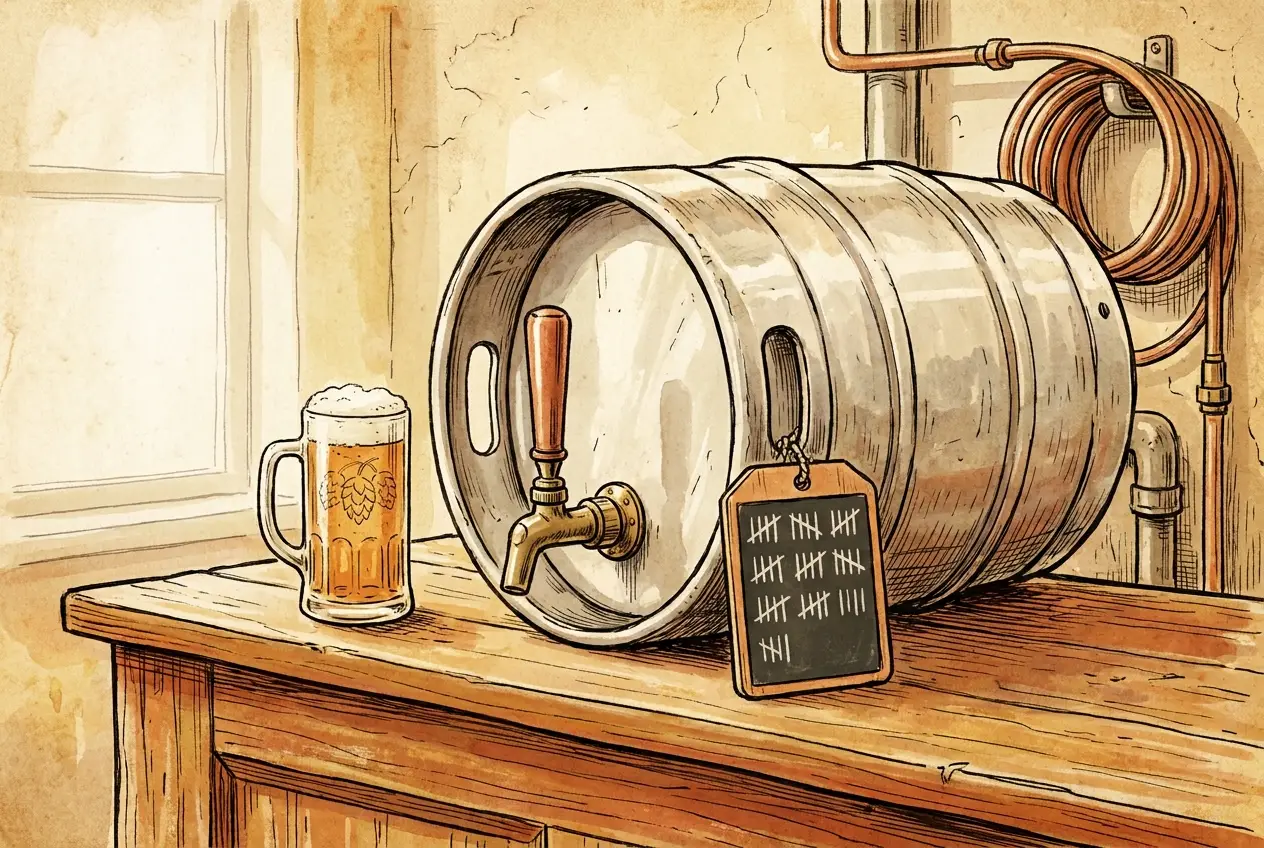 03
03 How to Price Draft Beer (Profit Per Keg, Not Per Pint)
How to price draft beer to a target pour cost, the real servable pints after foam, and the profit-per-keg number that matters. From a 5-year bar GM.
Read the piece 04
04 How Much Does DoorDash Actually Take From Restaurants?
What DoorDash, Uber Eats, and Grubhub really take per order, the fees the commission rate hides, and when delivery still makes money. From a 5-year GM.
Read the piece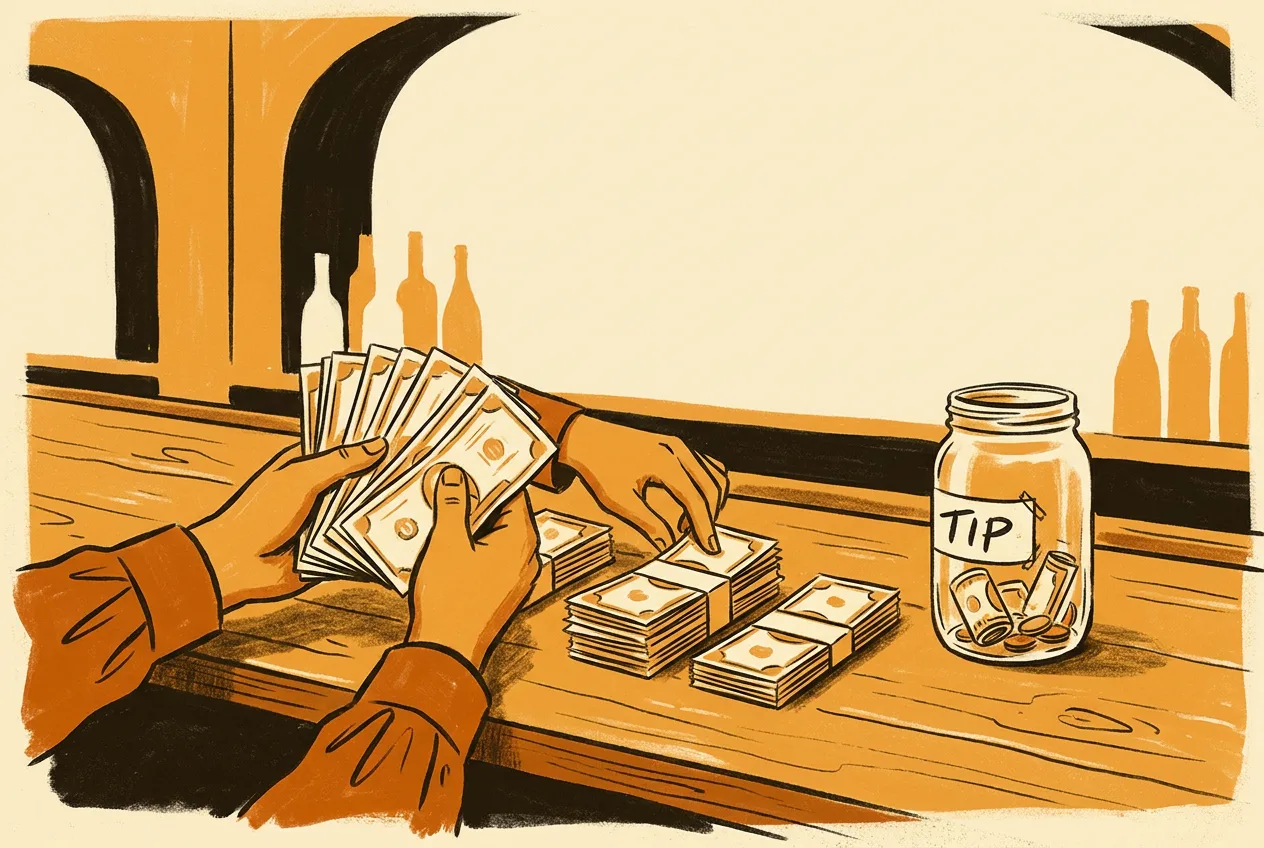 05
05 How to Calculate a Tip-Out (Servers, Bussers, Bartenders)
How tip-outs actually get calculated, standard percentages by role, and a worked shift example. The math, not the legal guide. From a 5-year GM.
Read the piece 06
06 The 7 Highest-Margin Items on a Restaurant Menu
The seven items that carry the most margin, ranked by a GM who ran the numbers, with the food cost percentage on each. From a 5-year GM.
Read the piece 07
07 Food Cost Went Up But Sales Didn't: 6 Things to Check
When food cost climbs but sales stay flat, the cause is rarely the menu. Six things to check first, in the order that finds it fastest. From a 5-year GM.
Read the piece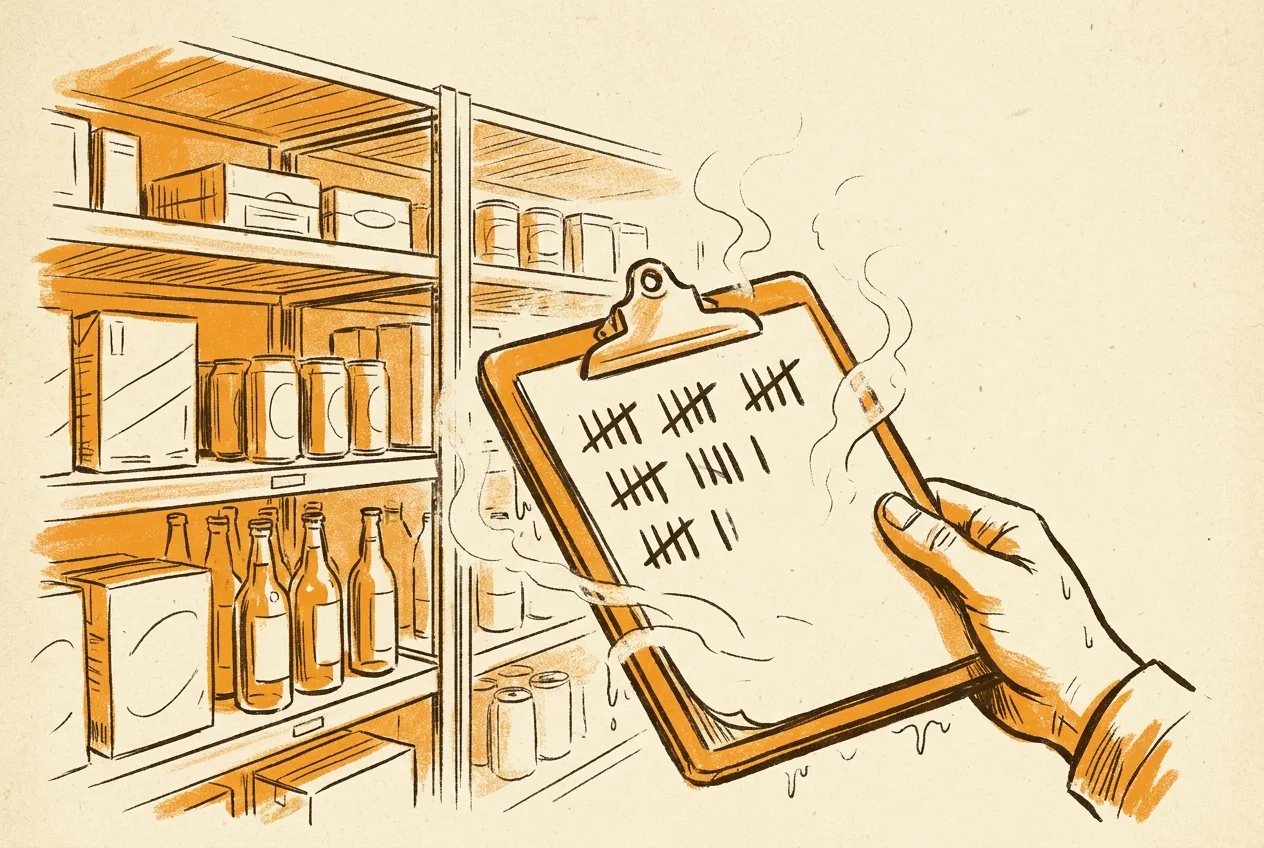 08
08 Is a 2% Inventory Variance Bad? What's Actually Acceptable
Acceptable inventory variance by category, why it is not the same as food cost, and how to set a target that catches leaks. From a 5-year GM.
Read the piece 09 How to Calculate Inventory Variance (The Number That Means Theft)
The inventory variance formula, the 1-3% acceptable band, and the five places variance hides before you blame theft. From a 5-year GM.
Read the piece 10
10 How Much Should You Charge for a No-Show Fee?
What a no-show actually costs, how to size the fee or deposit by party size, and the policy language that holds up. From a 5-year GM.
Read the piece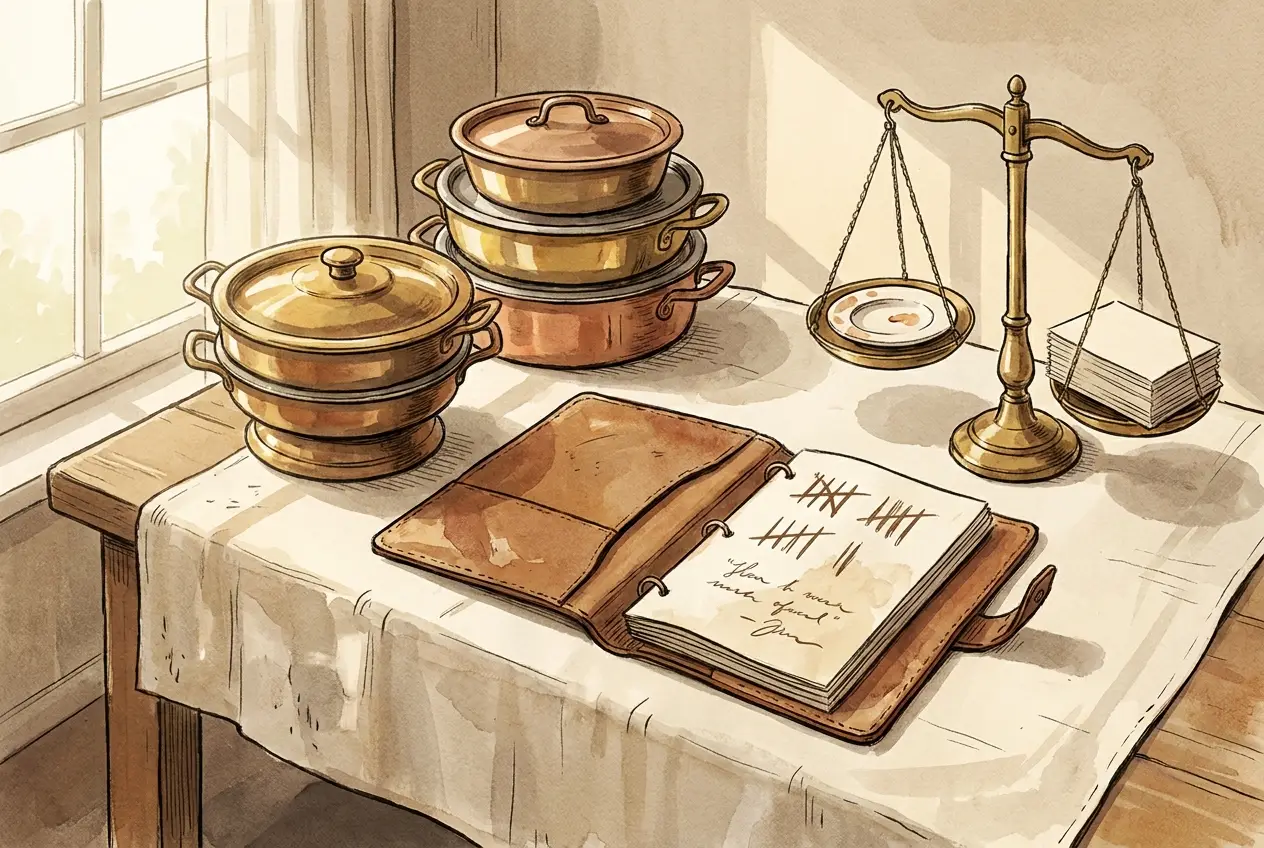 11
11 Catering Pricing: Off-Site Event Math (Beyond Food Cost)
Catering pricing formula that captures off-site labor, travel, equipment, minimum spend. Target margins 7-15% net, gross 65-70%. From a 5-year GM.
Read the piece 12
12 Ghost Kitchen vs Brick & Mortar (The Honest Cost Comparison)
Ghost kitchen vs traditional restaurant: startup cost, labor, margin, and the 60% failure rate nobody talks about. The break-even math by concept.
Read the piece 13 Charm Pricing vs Round Pricing on Restaurant Menus
The data on .99 vs round pricing: 24% retail lift, Cornell menu studies, when to drop the dollar sign, anchor and decoy pricing on menus.
Read the piece 14 Cost-Plus vs Margin Pricing (Three Menu Pricing Methods Compared)
Cost-plus, food-cost-target, and contribution-margin pricing compared. Same $4.50 cost, three different menu prices. Which method wins by concept.
Read the piece 15 Tip Pool vs Tip Out (When to Switch and When Not To)
Tip pool vs tip out: standard percentages, FLSA compliance, and four questions that decide which structure fits your concept. From a 5-year GM.
Read the piece 16
16 How to Reduce Restaurant Turnover (Real Numbers, Not Perks)
Retention strategies that actually work, the ROI math on bonuses and onboarding, and why manager training beats every other intervention. From a 5-year GM.
Read the piece 17
17 How to Reduce Labor Cost Without Cutting Hours
Five scheduling fixes that cut labor cost 2-4 points without firing anyone: staggered starts, forecast scheduling, OT control. From a 5-year GM.
Read the piece 18 Why Is My Food Cost Too High? 7 Root Causes (Diagnostic Order)
The seven root causes of high food cost, the diagnostic flowchart for finding which one is yours, and the triage order based on variance size.
Read the piece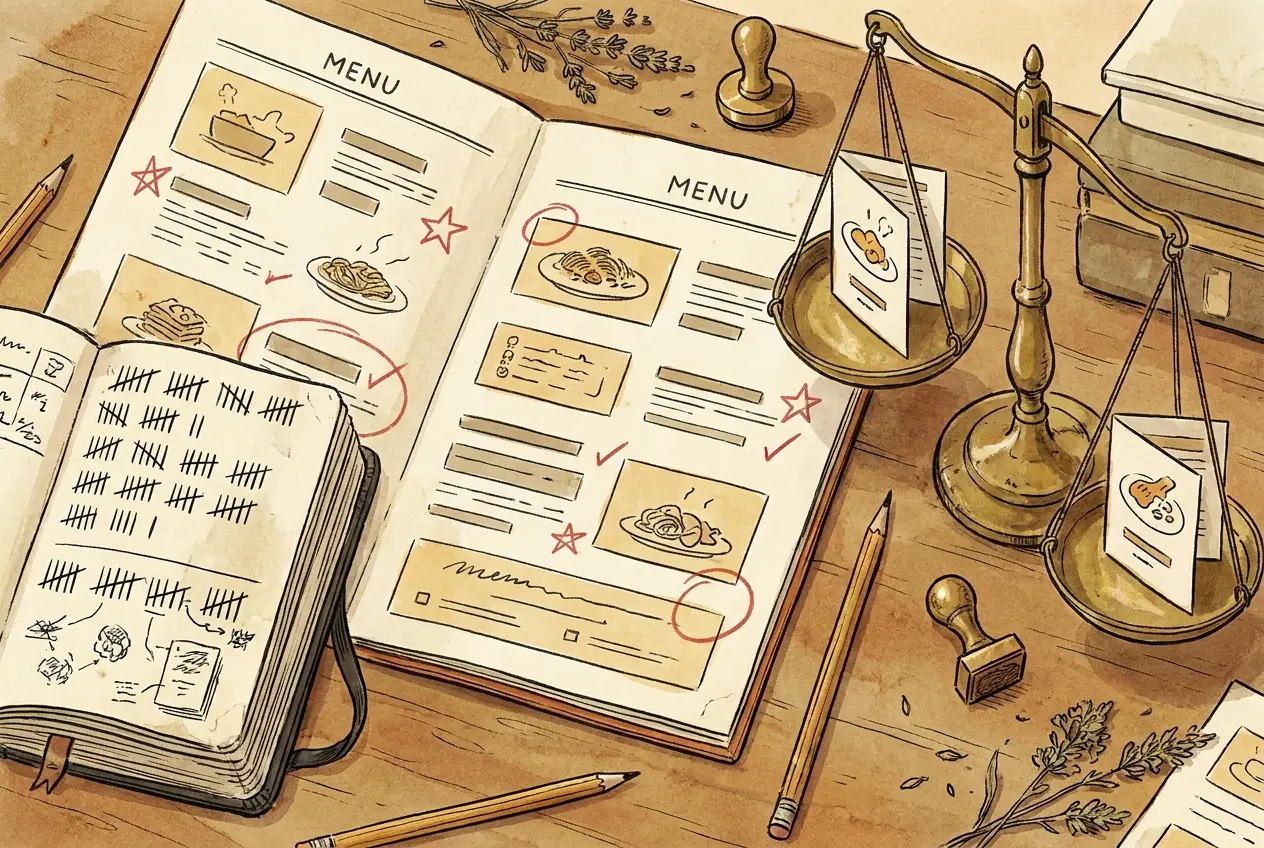 19
19 Contribution Margin vs Food Cost Percentage (Why Food Cost % Lies)
The dollar-vs-percentage trap that makes operators kill profitable items: why a 38% food cost steak makes more money than a 22% food cost salad.
Read the piece 20 What Is Menu Engineering (Stars / Plowhorses / Puzzles / Dogs)
The menu engineering matrix explained: how to classify items by margin and popularity, what to do with each quadrant, and when to rerun the analysis.
Read the piece 21 Theoretical vs Actual Food Cost (Variance Explained)
Theoretical food cost vs actual: what the gap means, acceptable variance bands by segment, and the five places variance hides. From a 5-year GM.
Read the piece 22 Restaurant Profit Margin Benchmarks (2026 Net by Segment)
Restaurant net profit margins by segment: full-service 3-8%, fast casual 4-10%, QSR 6-12%, ghost kitchen 10-15%. What 6% net actually means on $1.2M revenue.
Read the piece 23 Pour Cost Benchmarks for Bars (Beer, Wine, Liquor Split)
Pour cost targets by category: spirits 14-18%, beer 20-30%, wine 22-35%. The blended bar target and why single-number tracking misleads.
Read the piece 24 Average Labor Cost Percentage by Segment (2026 NRA Data)
Latest NRA labor cost benchmarks: full-service 36.5%, limited-service 31.7%. State and segment breakdowns. Where to actually target. From a 5-year GM.
Read the piece 25 Average Food Cost Percentage by Restaurant Type (2026)
Food cost benchmarks by segment: pizza, burgers, casual, steakhouse, sushi, fine dining. Industry-wide range 28-35%, with the segment-specific spreads.
Read the piece 26 Restaurant Break-Even Formula (In Dollars and In Covers)
Two break-even formulas every operator should run, the cover gap reading, and what changes when you add or kill a daypart. From a 5-year GM.
Read the piece 27 How to Calculate Pour Cost (And Why 20% Is the Wrong Target)
The right way to calculate liquor pour cost, why a single 20% target hides the bar program's real problem, and the math by category. From a 5-year bar GM.
Read the piece 28 How to Calculate Labor Cost Percentage (Beyond Just Wages)
The fully loaded labor cost formula most operators miss, why your $20/hr hire actually costs $26.40, and the segment-by-segment benchmarks. From a 5-year GM.
Read the piece 29 Food Cost Percentage Formula (With a Real Worked Weekly Example)
The food cost formula every restaurant should run weekly, three reasons your number is wrong even when math is right. From a 5-year GM.
Read the piece 30 How to Calculate Prime Cost (Weekly, Not Monthly)
The right way to calculate restaurant prime cost: weekly cadence, fully loaded labor, why a 60% target hides more than it reveals. From a 5-year GM.
Read the piece 31 What Restaurant Turnover Actually Costs (The $5,864 Per Quit)
Real cost of losing one hourly employee, why 75% turnover is normal but expensive, and the math on a $1,000 retention bonus. From a 5-year GM.
Read the piece 32 What Third-Party Delivery Actually Costs You (The Math Nobody Quotes)
Real all-in cost of DoorDash, Uber Eats, GrubHub. The fees commission rates hide and when delivery makes money. From a 5-year GM.
Read the piece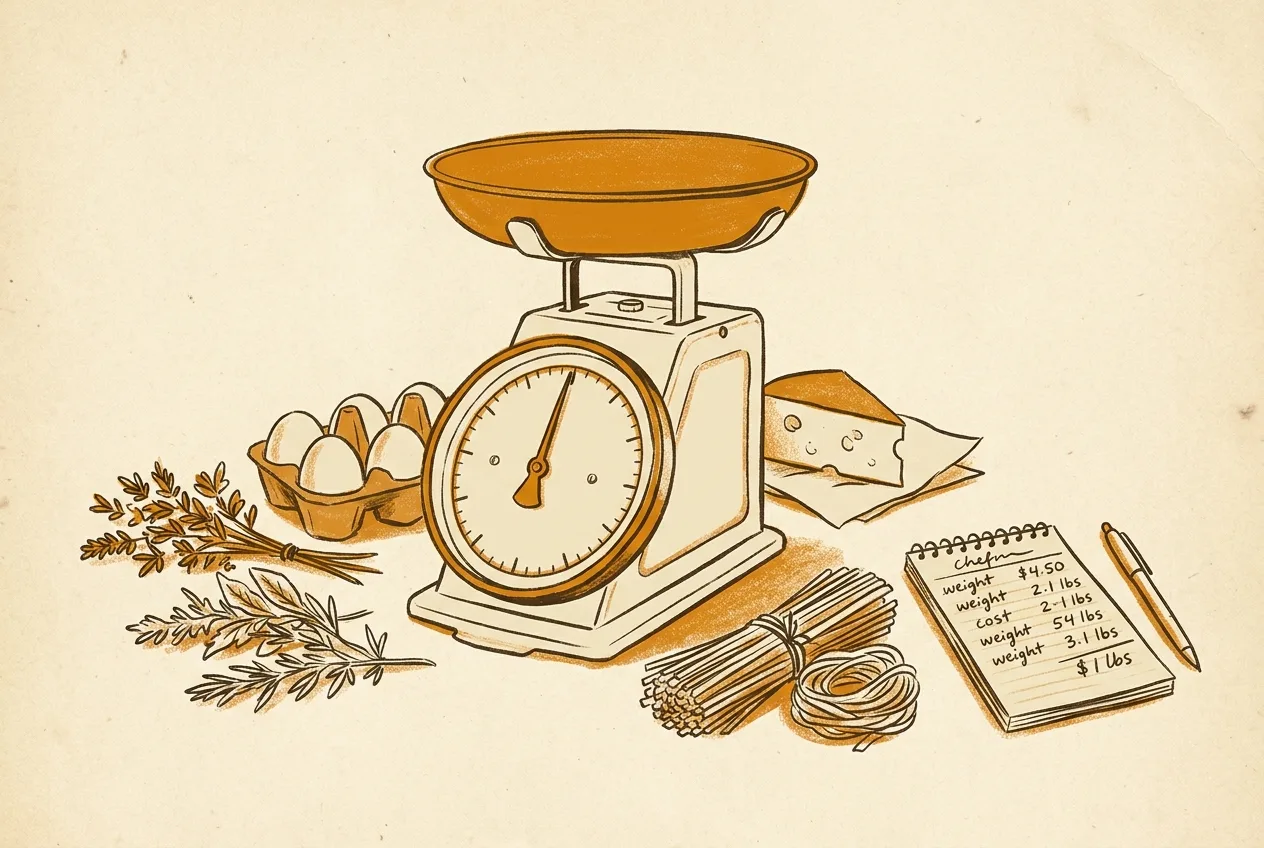 33
33 How to Cost a Recipe (The Yield Percentage Most Operators Skip)
How to cost a recipe plate-by-plate, why yield percentage matters more than spec sheets show, and the Q-factor most kitchens forget. From a 5-year GM.
Read the piece 34
34 Half-Barrel Pints, Foam Loss, and What a Draft Beer Actually Costs
From a 5-year bar GM: how many pints actually pour out of a half-barrel keg, why foam and line cleaning eat 5-10%, and what every pint really costs.
Read the piece 35
35 Soda Fountain Margin: How Much a Free Refill Actually Costs You
BIB math, ice fill, free refill multipliers, and the line-by-line on why fountain is the best margin on your menu, even with refills.
Read the piece 36
36 Sales Per Labor Hour: The Number That Tells You Who To Cut First
From a 5-year bar GM: the math behind the 9pm 'cut a server' decision, why SPLH beats labor cost % at the shift level, and concept-by-concept benchmarks.
Read the piece 37
37 Why Monthly Inventory Lies (And the Weekly Fix That Catches Leaks)
From a 5-year bar GM: monthly variance is too late, weekly is the real number, and the discipline of looking matters more than the math.
Read the piece 38
38 5 Ways Bar Pour Cost Actually Leaks (And Why Your % Lies)
From a 5-year bar GM: five real reasons your pour cost runs hot, why theft is rarely the first answer, and how to find the leak before it kills margin.
Read the piece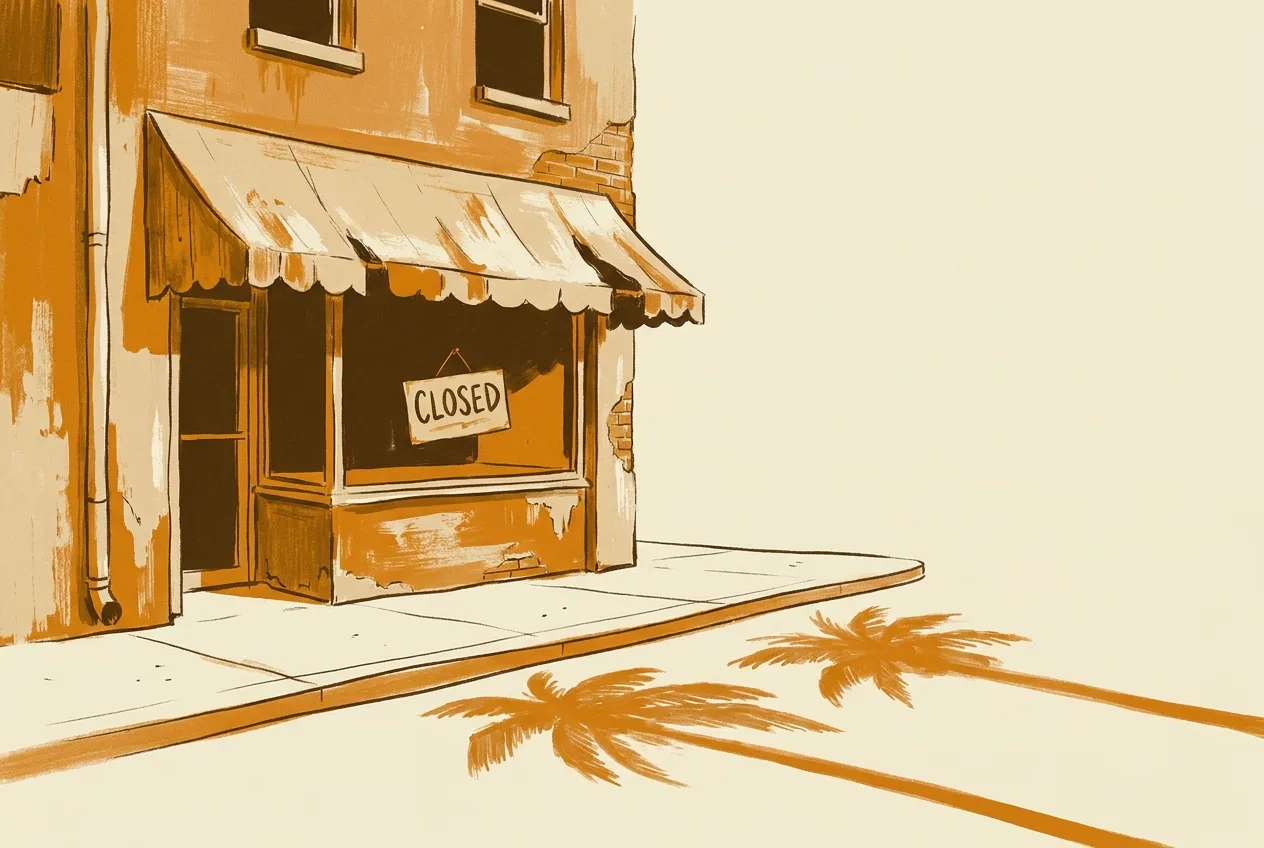 39
39 What Food Cost Actually Means (And What Killed Flaco's Cafe)
Food cost discipline isn't being cheap. It's knowing what you give away. Story of a Florida cafe that closed, and the weekly habit that would've saved it.
Read the piece 40
40 Tip Pool Legal Guide: FLSA, Tip Credits, and What Gets You Sued
Plain-English FLSA guide to tip pools written by a former bar GM. Manager prohibition, tip credit rules, state-by-state, and what actually gets operators sued.
Read the pieceWhy this exists
Most restaurant content online is either a paywalled SaaS pitch or AI-generated padding. This isn't. Every post here is written by a real operator about real operations, with citations, failure modes, and numbers you can verify. If something looks wrong, email me.
Industry data points cross-referenced with the National Restaurant Association, BLS NAICS 722, and DOL FLSA tip-pool guidance.