Why Monthly Inventory Lies (And the Weekly Fix That Catches Leaks)
I ran my first variance count three months too late.
By the time I sat down with the count book, the spreadsheet, and an honest evening, the leak was already big enough to be embarrassing. Not because anybody was stealing. Not because the kitchen was reckless. Just because three months is enough time for any of a dozen small things to compound, and nobody had been looking.
That is the entire problem with monthly inventory. By the time you see the gap, it is already a month old, and by the time you investigate, it is sometimes six weeks. The trail is cold. The bartender who was overpouring on Saturdays can’t tell you what they were doing five weeks ago because they barely remember last shift. The cook who was over-portioning on the lunch special swapped to dinner three weeks ago. Even the vendor short-ship that started the whole thing has moved on to the next operator.
Weekly inventory isn’t about tighter numbers. It’s about catching the gap while the trail is still warm.
This post is the case for switching from monthly to weekly counts and the practical guide to doing it without burning out the team.
What monthly inventory actually catches #
Monthly counts catch the obvious leaks. The ones a good GM already knows about, because the regulars have been complaining or the recipe specs are visibly stale or the walk-in temperature has been off for two weeks.
Monthly counts do not catch:
- Slow drift. A bartender pouring 1.7 ounces instead of 1.5 across thirty days is an enormous gap. One ounce extra times a thousand drinks is sixty-some-odd drinks worth of liquor. Your variance flags it. Your monthly count averages it across the whole window, so you see “high” and assume it’s normal seasonal noise.
- One bad week. A walk-in seal that fails for three days and gets fixed on the fourth is invisible in monthly numbers because the other 27 days dilute it. You’ll see the spike in spoilage cost on the P&L. You won’t see which days it happened, so you can’t point to the failure event.
- Vendor short-ships that get back-billed. The distributor is supposed to deliver six cases of well vodka. They deliver five. The driver writes “6” on the invoice. You sign it. Monthly count: you’re missing a case. Weekly count: you can call the distributor while the truck is still in town.
- Comp creep. Comp policies drift. A new bartender starts comping rounds for regulars without ringing the comp button. The owner brings friends in three Saturdays in a row. Monthly count picks up the dollar gap. It doesn’t pick up the who.
Why weekly works #
None of it is about the math being more accurate. It’s about everything around the math.
The trail is warm. A gap discovered on Monday for a week ending Sunday is investigable. The bartender who worked Saturday is still on the schedule. The kitchen who ran the special on Friday remembers what they 86’d. The cooler that warmed up on Wednesday probably still has the temperature log, if you set one up. Investigation is possible because everybody can recall.
The gap is smaller. A weekly variance of two percent is fifty bucks at most concepts. A monthly variance of two percent is two-fifty. Same two-percent number. The dollar amount, and therefore the seriousness, scales differently. Catching a fifty-dollar leak before it becomes a thousand-dollar problem is the entire game.
The discipline replaces the shock. I had to count bottles enough times for the habit of looking to replace the gut-punch of finding. By the third weekly count, I was no longer surprised by the gap. I was just diagnosing it. That mental shift is the thing that actually changes how you run the place. You stop reacting and start managing.
The benchmarks #
Before we get into the practical setup, the band:
- Best-in-class operators run under 1% variance of sales (industry benchmark, multiple sources)
- Acceptable / normal range: 2-3%
- In-trouble territory: sustained above 4-5%
- Open-investigation territory: anything over 6%
Those numbers assume you’re running concept-appropriate spec discipline. If your recipes are six months out of date, your variance number is a fiction either direction. Recost annually at minimum. Quarterly is better, and honestly that’s where I’d draw the line for anyone serious.
Theoretical vs actual: the comparison that catches real leaks #
Variance has two forms. Most operators only run one.
Actual variance = (theoretical usage based on POS sales × spec) versus (actual usage based on inventory count). This is the one most calculators help with. It catches the gap.
Theoretical-vs-actual food cost = (food sales × COGS percentage based on specs) versus (food sales × actual COGS percentage based on inventory math). This catches the system-level gap.
If your theoretical food cost is 28% but your actual is 33%, the gap is 5%. That gap can come from any of: bad portion control, stale recipe costs, vendor price changes you didn’t bake in, comp creep, waste, theft, training, equipment drift. Variance doesn’t tell you which one. It tells you the gap exists.
Running both numbers weekly is what separates operators who control their costs from operators who get a quarterly P&L surprise. The math is the easy part. The weekly habit is the discipline.
How to actually run weekly inventory without burning out #
Most operators don’t switch to weekly because they think it doubles the team’s workload. It doesn’t double anything. It changes the workload.
Cut the SKU list. Do not count everything every week. Count the A-items: the top 20% of SKUs that drive 80% of cost. For most concepts that is 20-40 items. Count those weekly. Count the long tail monthly. Pareto applies to your stock room as much as it applies to anything else.
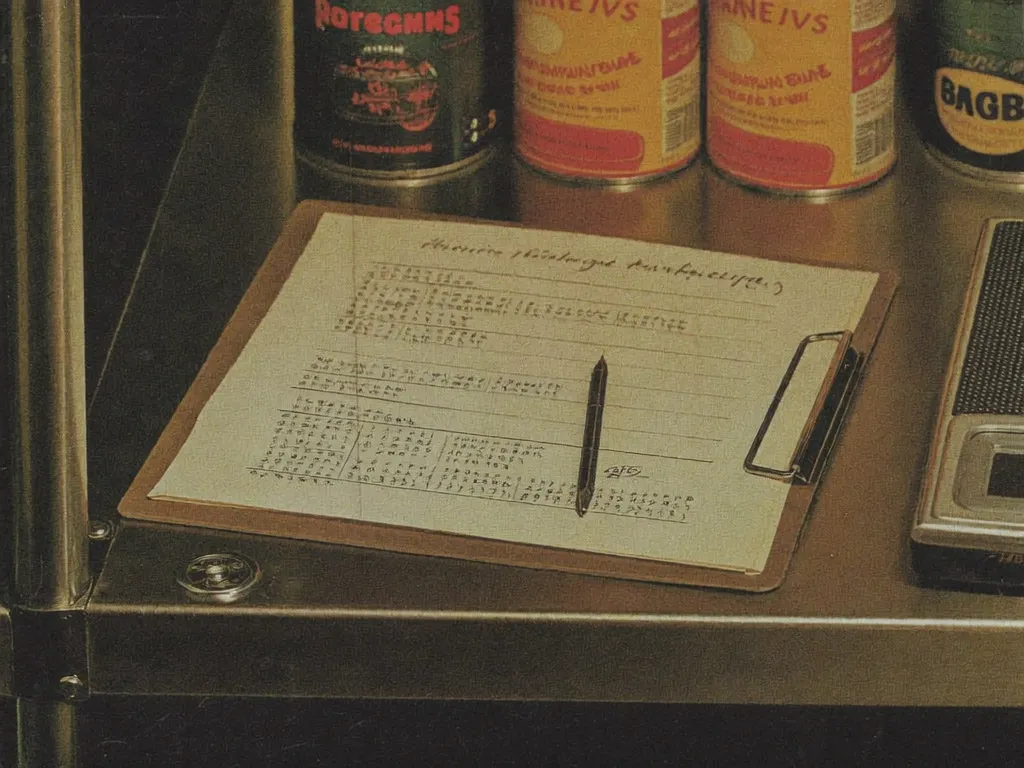
Standardize the count form. Same person, same time, same handwriting, same order through the walk-in. The form is the system. Switching counters mid-quarter is the fastest way I know to introduce phantom variance.
Friday close to Friday close. Pick a closing day that aligns with the natural slowdown. Sunday is brutal. Friday afternoon is rough but doable. Tuesday morning is the cleanest in most concepts. Pick one. Stick to it.
One person counts. The GM reviews. The count is one job. The reconciliation against the POS is the GM’s job. Splitting them protects against the most common variance fraud (the same person counts AND reconciles AND blames everyone else when the numbers are off).
Recipe cost monthly. Spec audit quarterly. A recipe priced at six-month-old vendor numbers will produce theoretical numbers that don’t match anything. Spec audit means walking the line and confirming the cooks are pulling the actual portion the recipe says. They drift. They always drift.
The Cosmos frame #
I worked in a sports bar in California for five years. The owner wasn’t heavily engaged in day-to-day operations. Three of those five years I was running variance reports because nobody else was going to. No playbook, no consultant. Just me, the count book, and the slow realization that the variance report’s job wasn’t to catch anything. Its job was to make the gap visible to a person whose job was to fix it.
If you’re reading this and your monthly variance has been “kinda high but not that bad” for the last six months, you don’t have a variance problem. You have a looking problem. The report is making the gap visible. Nobody’s looking. That’s the whole issue. Switch to weekly. Look harder. The math will follow.
What to do this week #
Pick a closing day. Pull yesterday’s POS sales report. Walk the cooler with a pen and a count book. Compare what the math says you should have used to what you actually have. The number you get is your starting baseline. Next week, do it again. Compare. Repeat.
If you want a tool that does the math for you without an email gate, we built one. Plug in opening, purchases, closing, and the theoretical from your POS. It tells you the variance, the dollar gap, and where it falls on the band. No signup. No upsell.
For the wider picture, the food cost percentage calculator and prime cost calculator handle the layer above this one, converting the variance you found into the P&L number that decides whether you are running a healthy program or a slowly closing one.
The number doesn’t lie, and it doesn’t have feelings about your bartenders or your line cooks or your vendor relationships. It just tells you whether the program is bleeding. Looking weekly is the difference between catching it on Monday and finding out about it on the next quarterly P&L.
Read next
What's a Good Prime Cost for a Bar vs a Restaurant?
A healthy prime cost by concept, why bars run lower than kitchens, and what your number should be. The benchmark, not the formula. From a 5-year GM.
How to Price a Cocktail (The Pour Cost Math Bars Skip)
How to price a cocktail off its real pour cost, the multiplier that works, and a worked build from spirit to menu price. From a 5-year bar GM.